Welcome
to my site devoted to research on the physics of baseball. My particular research interests are two-fold: the physics of the baseball-bat collision and the flight of the baseball. I have done quite a bit of independent research in both areas. I am also heavily involved with several areas of practical interest to the game. One is characterizing, measuring, and regulating the performance of non-wood bats, an area for which I have served on committees advising the NCAA and USA Baseball. Another is exploiting new technologies for tracking the baseball, such as TrackMan, Rapsodo, and now Hawkeye for novel uses in baseball analytics. But this site does much more than catalog my own work. It attempts to provide links to much of the high-quality work done over the past decade or so on various aspects of the physics of baseball. If readers know of a site that I have overlooked, please contact me.

Demonstrating the sweet spot of the bat in a talk I gave at Wrigley Field for University of Illinois alumni in 1997.
Recent Research Highlights
OK, it's not baseball...but it is sports physics.
Alan Nathan, April 12, 2023.
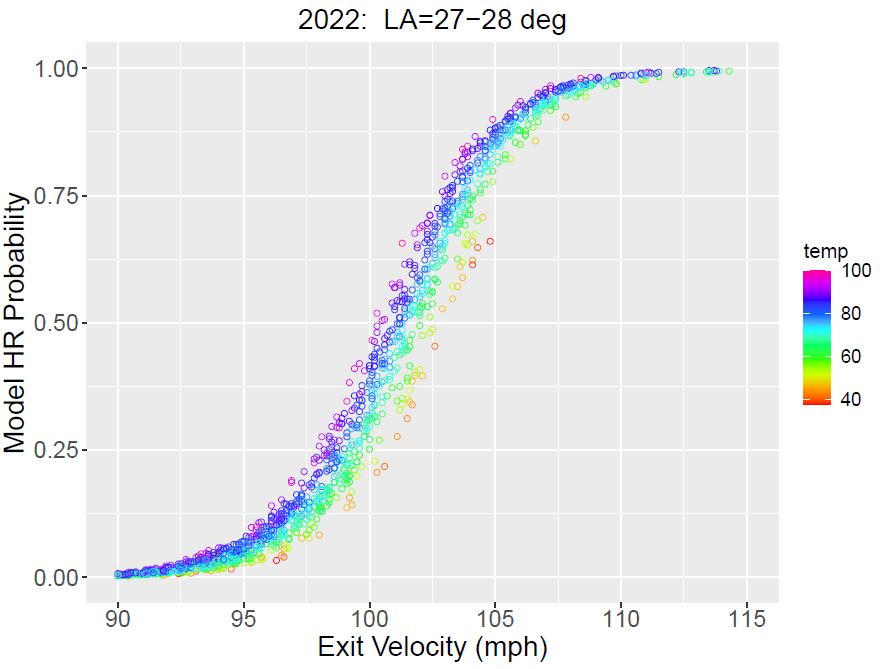
Home run probability vs. exit velocity for 2022 fly balls hit with launch angles in the range 27-28 degrees. The data clearly show the temperature dependence, indicated by color.
This article is an update to an earlier one from 2017. In both articles, I find that a 1-deg F increase in temperature results in a 1% increase in home runs. The analysis was inspired by a recent article by a group from Dartmouth entitled Global warming, home runs, and the future of America’s pastime, who found a similar results.
Alan Nathan, January 4, 2021 and updated January 5 with corrections.
Alan Nathan, March 18, 2021.
Alan Nathan, March 1, 2023.
Alan Nathan, Powerpoint Slides from SABR Analytics Talk, March 13, 2021.
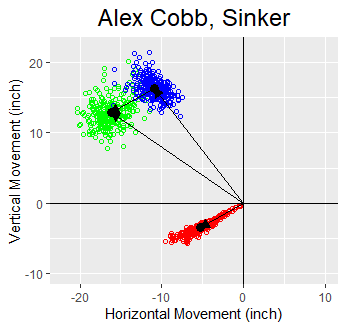
A plot showing the movement on Alex Cobb's sinker. The green, blue, and red points are the total, lift, and side movements, respectively. The black dots are the averages of each. For each point and for the averages, the green points are the vector sum of the corresponding blue and red points. The pseudo-nature of these data are discussed in the text.
As a followup to the "Not Just About Magnus Anymore" article (see link below), the first article sets up a formalism for separating the movement on a pitch into Magnus and non-Magnus components, using Hawkeye data on the spin components. The second article takes a slightly different approach in that it sets up a formalism for separating the movement into lift (i.e., in the direction of the Magnus force) and side (perpendicular to the Magnus force) components. Whereas the side component is necessarily non-Magnus, the lift component, while predominantly Magnus, may have some non-Magnus mixed in. An example of how to use the second formalism is shown in the above graph and is discussed in the text. Click here for a spreadsheet template for performing the calculations using both formalisms.
Barton Smith, Alan Nathan, and Harry Pavlidis, Baseball Prospectus, November 5, 2020
This article reports the first use of Hawkeye data to find evidence for pitch movement beyond that expected due to the Magnus force. The key to the analysis is that Hawkeye directly measures the spin axis, which can be compared with the axis inferred from the movement. Any difference between them is direct evidence for non-Magnus movement . Such behavior is shown in the graph below. Interestingly, the data show more arm-side movement for sinkers and changeups than would be expected based on Magnus, whereas the opposite is true for fastballs. Once the spin axis in 3D becomes publicly available, one will be able to measure directly the spin efficiency and quantiatively measure the magnitude and direction of both Magnus and non-Magnus movement. One will also be able to determine how drag coefficients depends on both the active and gyro spin rates.
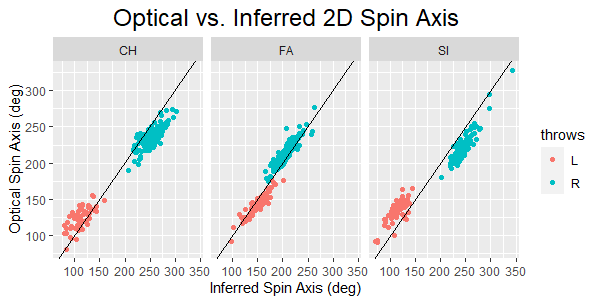
Plot of the optical spin axis, as measured by Hawkeye, vs. the spin axis inferred from the movement, for changeups, fastballs, and sinkers, with the line indicating equality. These data show clear evidence for non-Magnus movement.
Alan Nathan, May 25, 2020 update, Unpublished
Alan Nathan, August 31, 2020, Unpublished
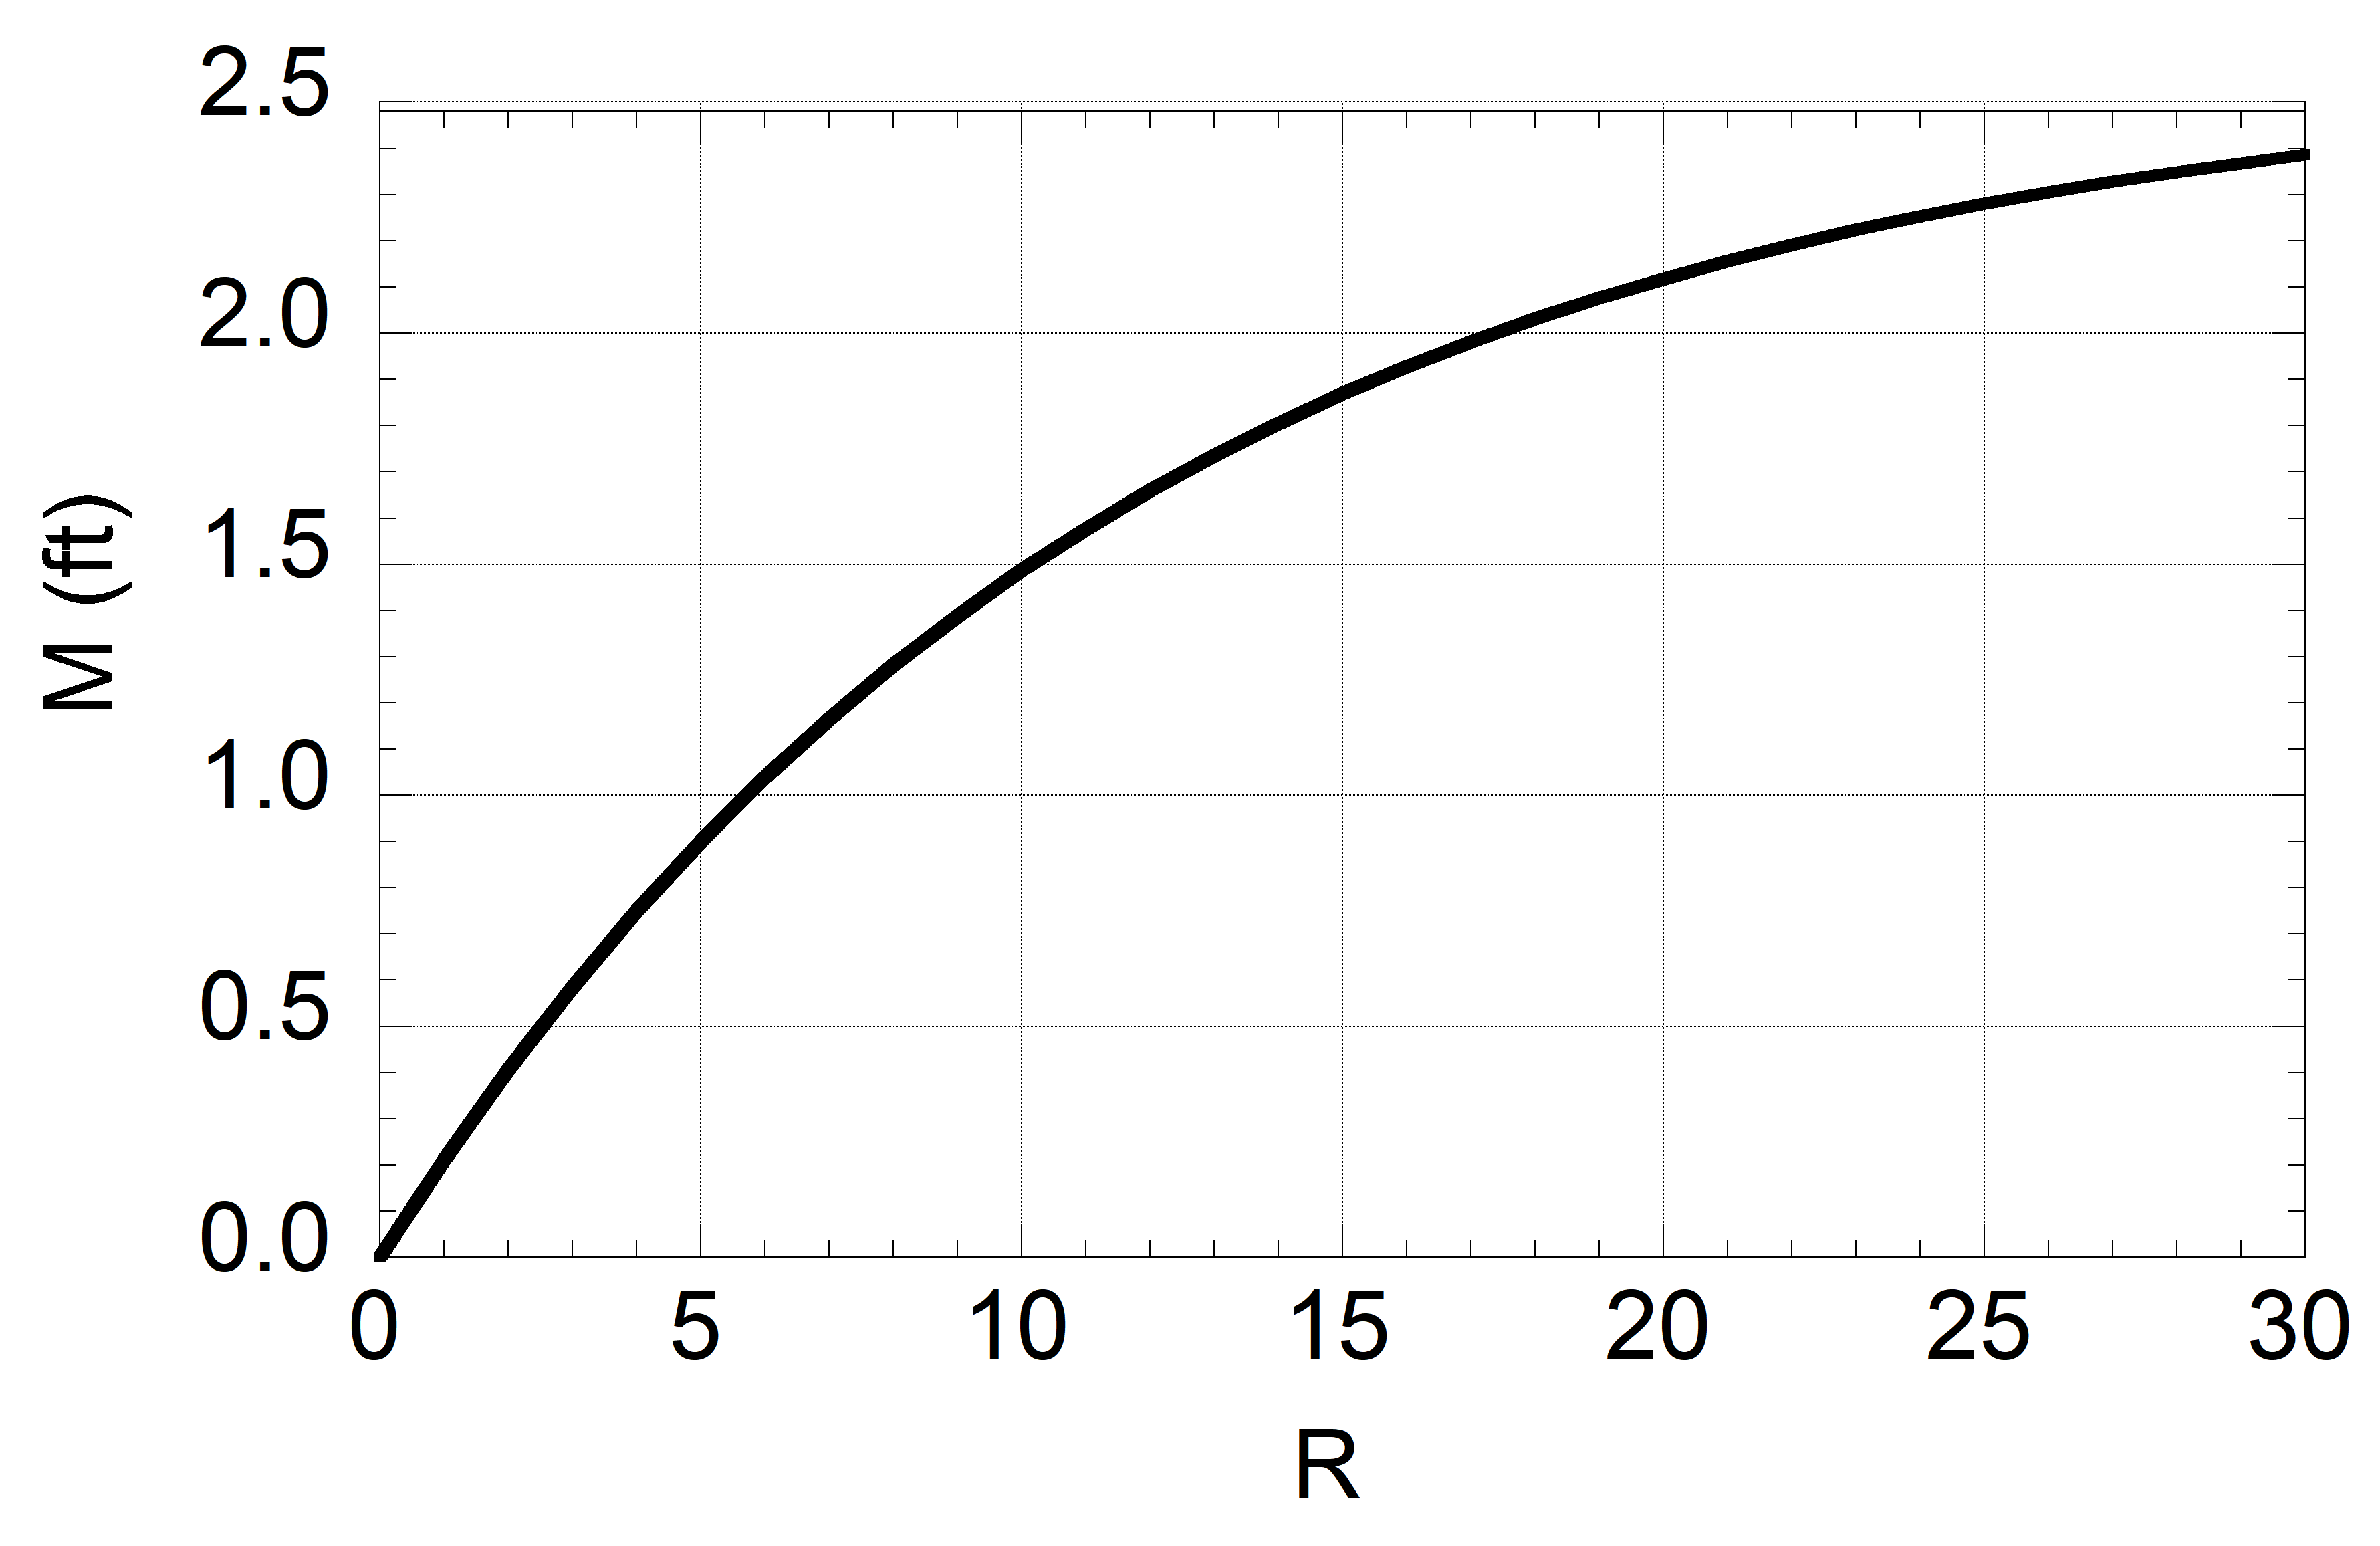
A plot of movement M vs. R, which is the number of rotations of the ball between release and home plate. The curve represents the upper limit under standard atmospheric conditions and is achieved when the spin efficiency is unity.
A technique is developed to determine the direction of the spin axis for pitched
baseballs. The method utilizes the Trackman measurement of the trajectory, specifically the spin-induced movement, to determine
the active spin. An important physics input to this method is the relationship between active spin and movement, which is separately determined from laboratory experiments under controlled conditions. The combination of active spin and the Trackman measurement of the total spin allow a determination of the spin axis in 3 dimensions and the spin efficiency, the latter being the ratio of active to total spin. A useful formula is developed relating the movement to the number of rotations of the ball between release and home plate. The role of experimental noise on the measurement of the trajectory is discussed. An important caveat is that the technique implicitly assumes that the movement is due to the Magnus effect and not to other possible forces on the ball. Click here for the spreadsheet template for performing the calculations.
The addendum points out an unresolved ambiguity in the relationship between spin and movement whenever the spin efficiency is less than one.
Alan Nathan, Unpublished
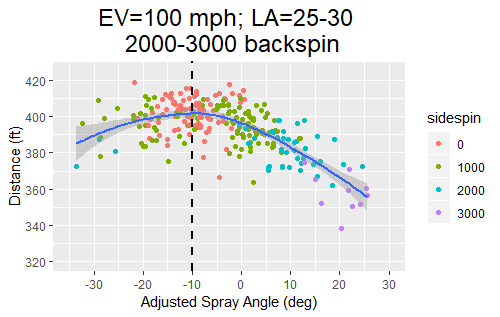
Statcast data showing the dependence of distance on spray angle (adjusted so that negative corresponds to pull, positive to opposite), color coded by the magnitude of sidespin (rounded to the nearest 1000).
These data show that the distance depends on spray angle and that sidespin reduces the carry of the ball.
This article is an analysis of the reasons why fly balls with otherwise identical launch conditions carry farther to centerfield than to left or right field.
I gave a talk on this topic at the 2022 SABR Analytics Conference. You can watch the video here and download the slides here.
Alan Nathan, Fangraphs, July 6, 2020.
Alan Nathan, July 20, 2020.
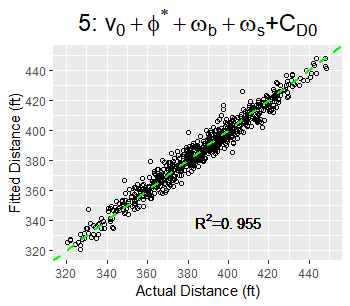
Plot of fitted vs. actual distance, controlling for the parameters shown at the top. The remaining rms variation of ~5 ft is due to measurement noise.
It is a known fact that for given launch conditions, there is a variation in the distance a fly ball carries. Various aspects of this were studied an earlier article and again in a followup article. The currently research takes full advantage of the Statcast capabilities for tracking the batted ball and determining its spin rate and spin axis to answer this question. After controlling for exit velocity, spray angle, and launch angle, the remaining rms spread of 11 ft come from four different sources in roughly equal contributions: variation of backspin from mean value; variation of sidespin from mean value; ball-to-ball variation in drag coefficient; measurement noise. The followup article shows, among other things, that the total spin rate provides far less information in determining the distance than does the individual backspin and sidespin components. It also shows that the measurement noise is dominated by the noise in the actual distance measurement rather than in the drag coefficient measurement.