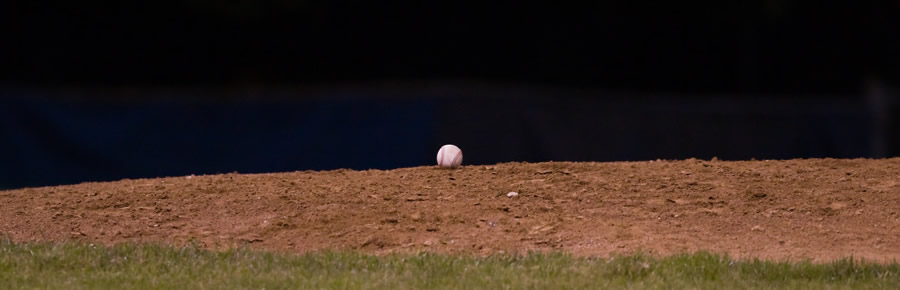
Baseball Aerodynamics
Baseball Trajectory Calculator--old version
Baseball Trajectory Calculator--new 2D version
Baseball Trajectory Calculator--new 3D version
Click on any link to go to a page with a description and download of a tool that can be used to do baseball trajectory calculations.
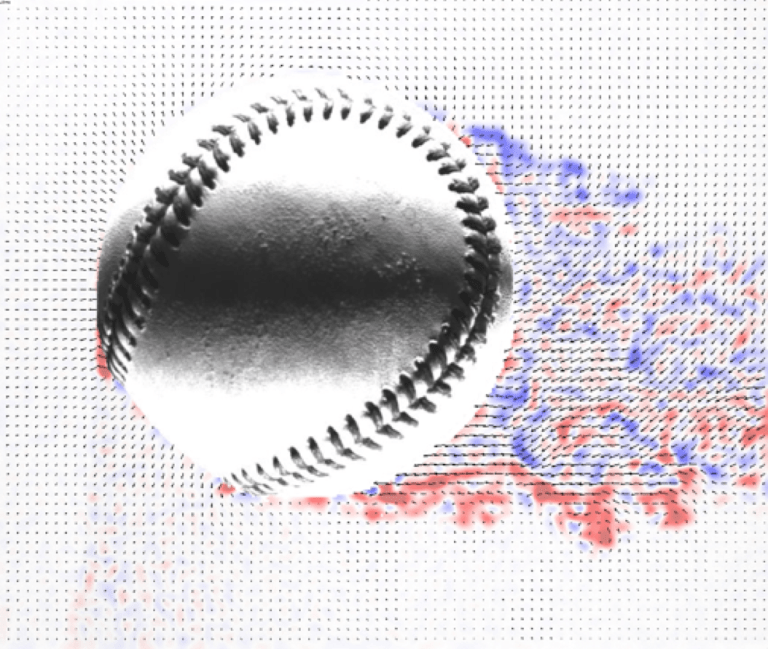
Airflow around a spinning baseball. The ball is moving from right to left and is spinning with backspin. Note that the wake behind the ball is deflected downward, resulting in an upward force on the ball.
This is a link to the website of Prof. Barton Smith, aka NotRealCertain. Barton, a Professor of Mechanical and Aerospace Engineering at Utah State University, is an expert on sports ball aerodynamics and especially on the use of the technique known as Particle Image Velocimetry to study air flow patterns around the moving object.
Christophe Clanet, Ecole Polytechnique, Palaiseau
Annual Review of Fluid Dynamics, 47:455-478 (2015).
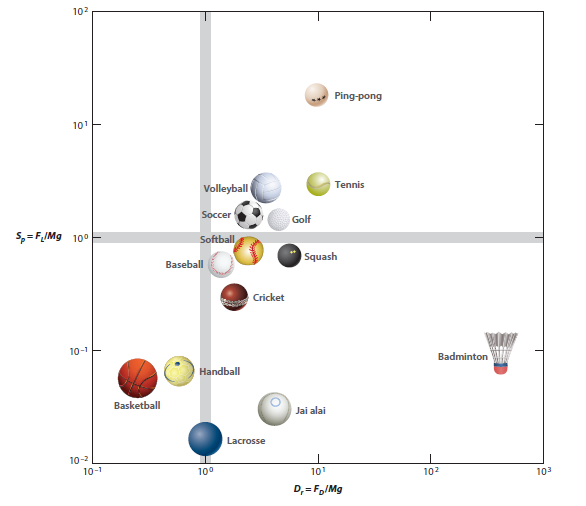
Postion of different sports balls on the lift-drag phase diagram. The axes are the typical ratios of lift-to-weight (vertical) and drag-to-weight for the different balls.
This is a beautifully written article about the aerodynamics of sports balls, including the effects of gravity, drag, and lift. He treats such diverse topics as the peculiar trajectory of a shuttlecock (badminton), the famous Roberto Carlos free kick (soccer), paradoxical popups (baseball), knuckleballs (lots of different sports), and the optimum size of different sports fields. He does what every good physicist should do: He reduces each problem to its bare essentials, making the necessary approximations in order to identify the underlying physics for each of the examples. This paper is a must read for anyone wanting to learn a physicist's approach to the physics of sports.
Here are links to additional articles co-authored by Clanet, along with colleagues and students:
- On the Size of Sports Fields This paper describes how the size of a sports field is related to properties of the ball (mass, diameter, drag coefficient) and the maximum velocity of the ball in the game.
- The Spinning Ball Spiral This paper describes spiraling motion of a spinning sports ball, due to the increase in the curvature of the trajectory as the ball slows down due to drag. The model is used to analyze the famous free kick of Roberto Carlos.
- The Aerodynamic Wall This paper describes trajectories in the limiting case where the drag force greatly exceeds the force of gravity. The formalism is applied to the trajectory of a badminton shuttlecock.
Fly Ball Carry and the Home Run Surge
Alan M. Nathan, The Hardball Times, August 24, 2017
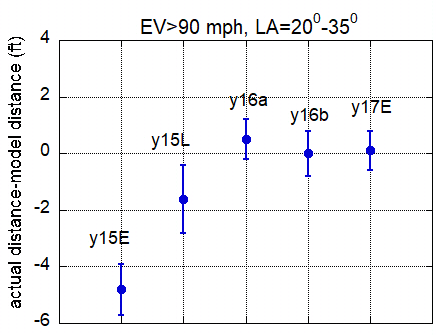
Result of the carry analysis
This article reports the results of an analysis of trajectories at Tropicana Field for the 2015-2017 season to determine if there is any change to the carry of a fly ball. Since the Trop is a domed stadium, atmospheric effects are constant and any change in carry can be attributed to changes in the drag properties of the baseball. A five foot increase in carry is found for 2016-2017 relative to pre-ASG in 2015, as shown in the figure. A more technical version of this article can be found here.
Alan Nathan, The Hardball Times, July 18, 2016
Home runs are up significantly in 2016.
In this article, I take a deep dive into the increase in home runs in MLB during the first half of 2016. This increase can mostly be accounted for by an increase batted ball exit speed for balls hit in the angular range 200-350, the "sweet spot" for home runs. Does that mean the baseball is "juiced"? Read the article and especially the Addendum to get my view. I gave a talk about this at the 2016 Saberseminar and the slides are available here. Finally, I discussed this topic in some detail on a BP Toronto podcast, August 25, 2016, with my interview starting at approximately 21:00.
For another point of view, see the excellent article Are Juiced Balls The New Steroid?, by Ben Lindbergh and Rob Arthur. Early in the 2017 season, three new articles about this issue have appeared: As Home Run Rates Rise, MLB Offers Evidence That the Ball Isn’t Juiced by Ben Lindbergh, Juice the ball. Or don't juice it. Just tell us! by Sam Miller, and Let's Assume the Ball Isn't Juiced ... by Russell Carleton.
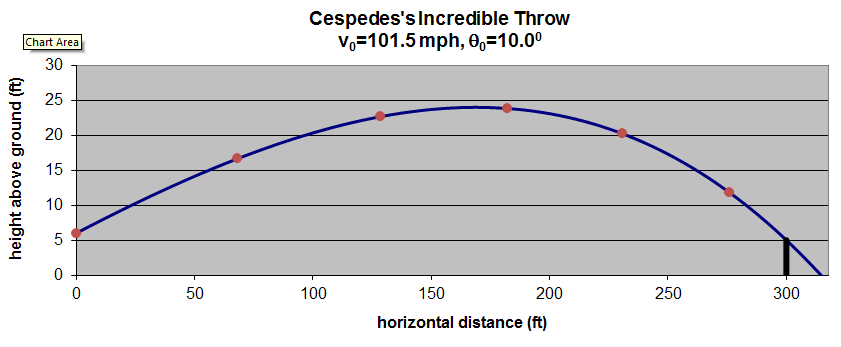
Trajectory of Cespedes's amazing throw, from release on the left to catch on the right. The red dots show the position of the ball at half-second intervals. The bar at 300 ft shows the location of the ball when caught by the catcher.
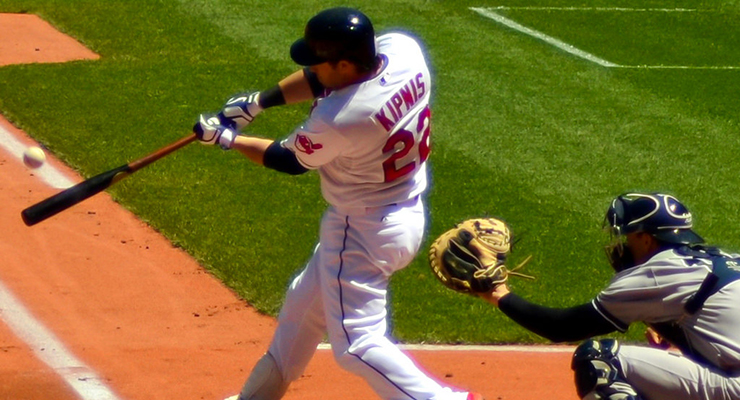
The article is an analysis of an amazing throw by Oakland A's leftfielder Yoenis Cespedes the previous day, thowing out a runner at home plate with a perfect strike carrying about 300 ft on the fly. Note the comment I posted on the article where I used updated information to re-analyze the trajectory. Using a total distance of 300 ft and a hang time of 2.80 sec, I find that the ball was released with a speed of 101.5 mph and a vertical launch angle of 10.0 degrees. The correct trajectory is shown in the plot just above. In a followup, my student Eric Lang has analyzed some other historic throws in an article, A Physics Comparison of Great Throws From Years Past, published in The Hardball Times, June 24, 2014. A composite plot of the Cespedes throw plus seven others is shown below.
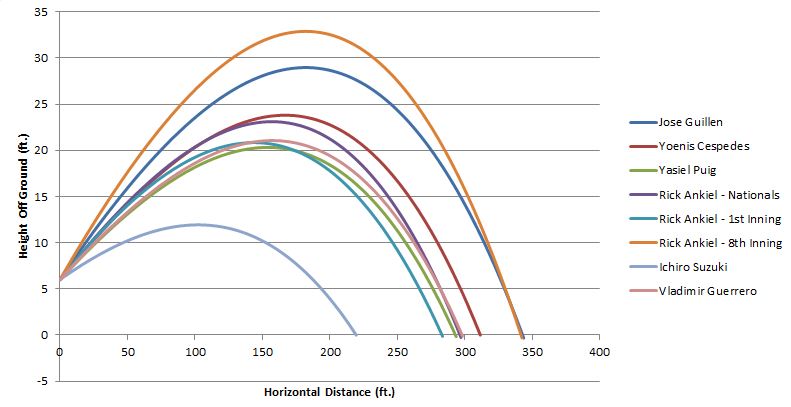
Trajectories of eight amazing throws.
The Physics and Timing of the Outfield Bounce Throw
Andrew Dominijanni, The Hardball Times, August 21, 2018
Andrew (@ADominijanni) does a wonderful physics-based analysis quantifying the relative merits of the on-the-fly vs. bounce throw from the outfield.
Effect of Temperature on Home Run Production
With the start of the 2017 World Series in Los Angeles and with tempertures well into the 90's, I did a "back-of-the-envelope" calculation of how a change of temperature affect the home run production. I find that, on average, an increase of temperature by 1-deg F increases fly ball distances by about 0.33 ft, leading to approximately 1% more home runs.
The motion of an arbitrarily rotating spherical projectile and its application to ball games, link to an article by Garry Robinson and Ian Robinson published in Physica Scripta (vol. 88, No. 1). The authors set up a formalism for numerically calculating trajectories of spherical sports balls, including the effect of wind. They then use their formalism to study some interesting effects for both golf and cricket balls. The formalism is identical to that used in my own trajectory calculator (see link above). Nevertheless, the applications are quite interesting.
Determining Aerodynamic Properties of Sports Balls In Situ, a pdf file of the MS thesis of Jeff Kensrud of Washington State University (Professor Lloyd Smith, Advisor). This research is the most comprehensive set of measurements of drag and lift coefficients of sports balls without the use of wind tunnels. One particular notable resuls: The drag coefficient on the flat-seam MLB baseball is about 25% smaller than that of a raised-seam NCAA baseball, leading to considerably more "carry" for the MLB ball. Jeff summarized his results in a paper presented at the 2010 ISEA conference.
Baseball Prospectus, January 8, 2013
Suppose we have data telling us the velocity of a fly ball just after leaving the bat, so that we know the batted ball speed, vertical launch angle, and horizontal spray angle. How well does that information determine the landing point? Such a question might arise, for example, in a batting cage situation. You measure the batted ball velocity—perhaps with a portable HITf/x or TrackMan system—and immediately tell the batter that he just hit a 385-ft home run, without the ball ever leaving the batting cage. But is this really possible? In a simpler, gravity-only world—I like to refer to it as the “Physics 101” world—it most definitely is possible. Under such conditions, once the initial velocity is known, the ball follows a trajectory that is completely predictable, landing in a location that can be calculated precisely with no more knowledge than one learns in the second week of Physics 101. End of discussion, right? Wrong! To learn how we know and speculation as to why that might be, read the article, which appeared in Baseball Prospectus on January 8, 2013. The comments are interesting, so be sure to read those also.
Alan M. Nathan, Lloyd Smith, Jeff Kensrud, Eric Lang, Baseball Prospectus, December 9, 2014
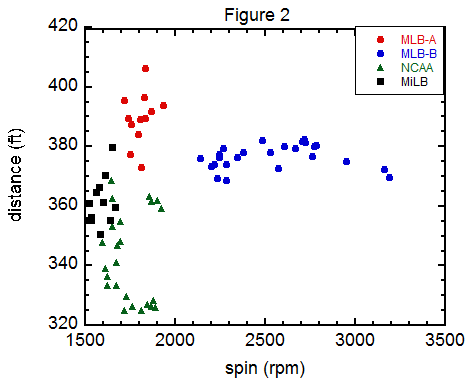
This article is a followup to a previous article How Far Did That Fly Ball Travel? published in Baseball Prospectus on January 8, 2013. It is an account of our experiment at Minute Maid Park in Houston, January 2014. The object was to measure the distance of fly balls projected into the outfield with a fixed initial speed of 96 mph and vertical launch angle of 280. In an ideal world, all baseballs would land at the same place. But as the figure shows, there is great variation in the distance, depending not only on the type of baseball (NCAA, MiLB, MLB) but even which baseball of a given type. Interestingly, the data also show very little variation in distance for backspin rates in the range 2200-3200 rpm. An important conclusion is that variation in fly ball distance is due much more to ball-to-ball variation in the drag (for example, due to small differences in surface roughness) than to variation in spin. Further evidence for ball-to-ball variation of drag comes from PITCHf/x data, about which an article will be written soon. Further evidence for MLB home run distances being nearly independent of spin will also be presented in a future article.
NOTE: If you are not able to access the Baseball Prospectus article, you read it here.
The Gyroball What's all this gyromania about? To find out, click on the link.
How Much Does a Fly Ball "Carry"? Read a brief account on an analysis I did to quantify the term "carry". Included is an analysis of the home runs in the new Yankee Stadium to see if there is any measurable effect of wind.
Baseball At High Altitude. A brief description of the forces on a ball in flight, how thoses forces differ at Coors, and their effect on the flight of both pitched and batted baseballs. Also discussed here is the effect of the famous humidor in which the baseballs are stored at Coors.
Home Runs and Humidors: Is There a Connection?, an article I wrote for Baseball Prospectus. Be sure to read the comments, since near the bottom I give my "best and final" numbers for both Coors and Chase. The article is based on a paper I co-wrote with Lloyd Smith entitled Corked Bats, Juiced Balls, and Humidors: The Physics of Cheating in Baseball, published in June 2011 issue of American Journal of Physics.
Revisiting Mantle's Griffith Stadium Home Run. A writeup of my reanalysis of The Mick's famous tape measure shot from 1953. An account of this work also appears in Chapter 6 of the new biography of Mantle, The Last Boy, by Jane Leavy, published in October 2010. I gave a public presentation of this topic in Urbana on November 12, 2010 as part of the program of the Baseball Music Project, with HoF'er Dave Winfield as the MC. More recently, I presented an updated talk to the Champaign Rotary Club, October 3, 2018. Finally on April 17, 2023, the 70th anniversary of the event, I gave a talk to the Northern New England chapter of SABR, a video of which can be found here.
ESPN Home Run Tracker: A web site due to Greg Rybarczyk that reports on home run distances, meaning how far the ball would have traveled had it made it back to ground level without hitting something first. Greg's algorithm is based on his measurement of the precise location where the ball hit and the total flight time, both of which serve as input to his aerodynamic model to extrapolate the trajectory to ground level. The model takes into account drag, lift, and atmospheric conditions. In the absence of additional information about the batted ball, it is the best algorithm currently in use for determining home run distances. Listen to an interview Greg gave on hittracker on October 26, 2011 for 1080TheFan ESPN radio.
Bonds 756th home run. My analysis of the trajectory of Barry Bonds' record-breaking 756th home run.
Dissecting a Mystery Pitch, an article published January 31, 2012 at The Hardball Times.
The article is about a pitch from April 29, 2011 during the top of the 1st inning of a Toronto at New York game. Yankee pitcher Freddie Garcia threw a split-fingered fastball to the Jay's Juan Rivera. Using the high-speed video shown to the right, it is possible to measure the rotation on the ball, including the rotation axis. The ball breaks in a direction not consistent with the rotation axis, assuming the usual Magnus effect. The article unravels this mystery, with the aid of some experiments by by frequent collaborator Rod Cross. There was lots of discussion about this topic at Tom Tango's Inside the Book blog. Note that the first 32 comments appeared prior to the article appearing in The Hardball Times. Finally, the New York Times got into the act with a story that appeared in the August 5, 2012 edition entitled Challenging Batters and Physics Experts Alike, by Zach Schonbrun. Zach conducted a telephone interview with me a few days earlier. I was sitting in the stands at Doubleday Field in Cooperstown when we had the interview! See also The Yankee Analysts for a discussion by Michael Eder of a nearly identical pitch Garcia threw to Pedro Ciriaco of the Red Sox on July 7, 2012.
The effect of spin decay on the flight of a baseball.: A brief unpublished essay in which an estimate is made of the rate of spin decay of a baseball in flight and the effect of the spin decay on the flight of a baseball.