
Analysis of Barry Bonds' Record-Breaking Home Run
Introduction

Barry Bonds broke Hank Aaron's record for career home runs when he hit his 756th home run on August 7, 2007 (video). A brief analysis is presented here of the trajectory of the home run. The picture below was taken close to the moment of impact.
The data for this analysis come from two sources. First, the initial part of the trajectory was established from an analysis of the video provided by the PITCHf/x tracking cameras. These cameras provide precise information on the trajectory of pitched baseballs but can also be used to provide information on batted baseballs within their limited field of view. Second, the endpoint of the trajectory was provided by Greg Rybarczyk of hittrackeronline.com, who provided precise information on the location the landing point and the time of flight. As we shall see, if both the initial and final parts of the trajectory are known well, it is possible to put very tight constraints on what happens in between.
The PITCHf/x Tracking Data
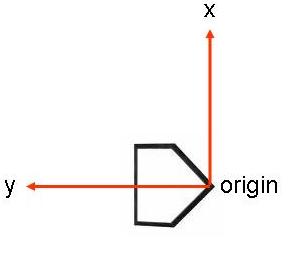
These data consist of seven points at 1/60-second time intervales starting approximately 1/30-sec after contact. Each point consists of a time t and the (x,y,z) coordinates in the so-called Global Coordinate System (GCS). The GCS has its origin (0,0,0) at the corner of home plate. The y axis extends along the catcher-pitcher line, the x axis is the horizontal line perpendicular to the catcher-pitcher line, with the positive direction pointing to the catcher's right, and the z axis points vertically upward. The figure to the right shows a bird's-eye view of the coordinate system. The coordinates of these points were determined by manually locating the location of the baseball in pixel coordinates in each frame for each of the two tracking cameras. One camera is located on the first-base side, high above and looking downward. The other camera is located at a comparable position on the third-base side. Using the known camera calibration, these coordinates determine a so-called line of position (LOP), which is a line connecting a known reference point on the camera to the baseball. The coordinates of the intersection of the LOP's for the two cameras is the actual location of the baseball in the GCS. It is estimated that the position of the baseball is determined to a precision of approximately 1 inch. The seven frames covered the first 20 ft (horizontal) of the trajectory, with a height above home plate in the range 4-12 ft.
The HITTRACKER Data
These data consist of a single datum which comes from the observation of where the home run landed and the total time of flight. According to Greg Rybarczyk, the ball landed at the GCS coordinates (x,y,z)=(103.7,416.3,12.17), with all distances in feet. The total time of flight from contact to landing was determined to be 5.12 sec by playing back the broadcast video and counting frames.
The Home Run Trajectory
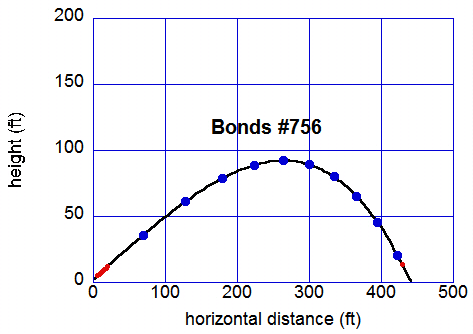
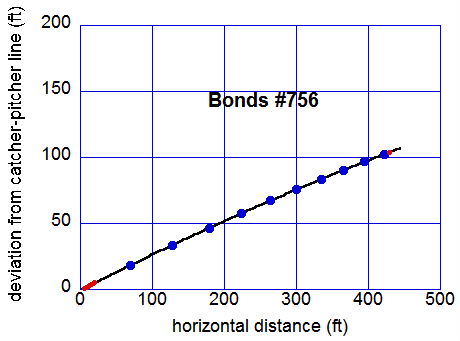
The trajectory of any fly ball can be calculated given the initial conditions (location, velocity, and spin) and a model for the forces acting on the ball. These forces include gravity, air resistance, and the Magnus force on a spinning baseball. For the present calculation, the prescriptions of Adair1 and Sawicki et al.2 were used for the air resistance and Magnus force, respectively. With these assumptions, the full trajectory can be calculated for given initial conditions. The latter are adjusted in a least-squares fitting procedure to provide a best fit to the eight tracking points (seven from PITCHf/x and one from HITTRACKER). A total of 8 parameters were adjusted: the three initial positions of the coordinates x0, y0, z0; the initial velocity v0, elevation angle θ0, and fan angle φ0; and the amount of backspin and sidespin, ωb and ωs, respectively. Here θ0 is the angle above the horizontal and φ0 is angle the initial trajectory makes with the y axis when projected onto the horizontal plane. The sign convention is such that a ball hit toward first-base, second-base, or third-base correspond to φ0 = 45, 0, or -45 degrees, respectively. The fitted parameters are given in Table I and the best-fit trajectory is shown in Figures 2 and 3. The fitted trajectory has an root-mean-square (rms) deviation from the data of only 1.2 inches. Note that the spin of the baseball is not actually measured but is inferred from the tracking data within the context of the model used for the Magnus force.
| parameter | fitted value ± uncertainty |
| x0 | -0.23 ± 0.09 ft |
| y0 | 1.02 ± 0.03 ft |
| z0 | 2.51 ± 0.09 ft |
| v0 | 112.4 ± 0.3 mph |
| θ0 | 27.0 ± 0.3 deg |
| φ0 | 16.0 ± 0.4 deg |
| ωb | 1186 ± 71 rpm |
| ωs | 189 ± 40 rpm |
Acknowledgments
Thanks to Marv White from Sportvision for providing the video for the PITCHf/x analysis along with his excellent tutorial on how to convert to GCS coordinates. Thanks also to Greg Rybarczyk from hittrackeronline.com for providing the precise landing information.
References
[1] Robert K. Adair, The Physics of Baseball, 3rd edition (HarperCollins, New York, 2002).[2] G. S. Sawicki, M. Hubbard, and W. Stronge, "How to hit home runs: Optimum baseball bat swing parameters for maximum range trajectories," Am. J. Phys.71, 1152-1162 (2003)