Trajectory Calculator--old version
This page describes a "trajectory calculator", a tool for calculating your own trajectories of pitched or batted baseballs. This is the old version. Click
here for the new version.
Baseball Trajectory Calculator--old version
(updated, June 10, 2015)
Click on the link to download an Excel spreadsheet that can be used to do baseball trajectory calculations, including the effects of air drag, spin and the Magnus force, and wind. In the most recent update, an option now exists for the wind to act only above a specified height. The wind speed in entered in cell B17 and the height above home plate level is specified in cell B19. In a previous update, a "Fitting" worksheet was been added. This worksheet allows one to specify the initial position and velocity for a batted ball, presumably determined from a system like HITf/x or TrackMan, as well as a landing point and hang time. Then, using the Solver tool of Excel, the spin parameters and drag coefficient are adjusted to fit these conditions, with the result that the full trajectory is determined. A fuller description of this technique, including its validity, is described in
What New Technologies Are Teaching Us About the Game of Baseball. See particularly the discussion related to Figure 5.
In the next paragraphs, I describe some sample outputs from the calculator.
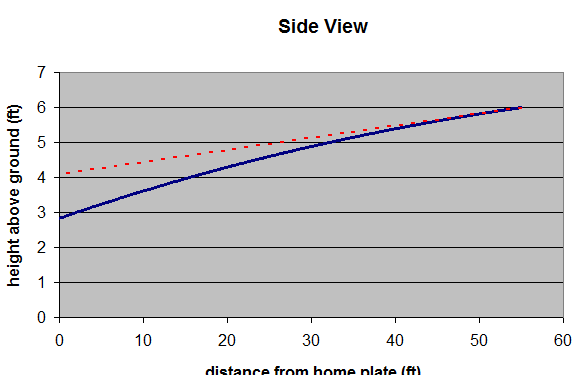
Side view of pitched ball trajectory.
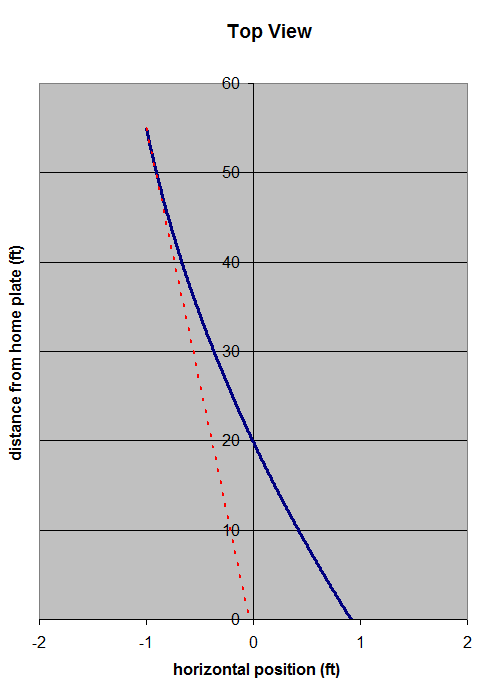
Top view of pitched ball trajectory.
The default parameters for the pitched baseball are as follows. It is released 55 ft from home plate (y0), 1 foot to the 1B side (x00, 6 ft off the ground (z0), and a release speed of 95.0 mph (v0), with a slightly downward initial trajectory of 2 degrees (theta) with a slight left-to-right angle of 1 degree (phi) and with 1500 rpm of backspin (wb) and 1000 rpm of sidespin (ws). The trajectory for this pitch is shown in the two figures, with the blue curve being the actual trajectory and the dotted red curve being the path the ball would follow if it never strayed from its initial straight line at the release point (55 ft). For the side view, the difference between the two curves at home plate (0 ft) is the total vertical movement, which is determined in part by gravity (which pulls the ball down) and in part by the Magnus force (which pulls the ball up). The net vertical movement is about 1 ft downward. For the top view, the difference between the two curves is the movement due entirely to spin. As the figure shows, the ball breaks to the catcher's right by about 1 ft.
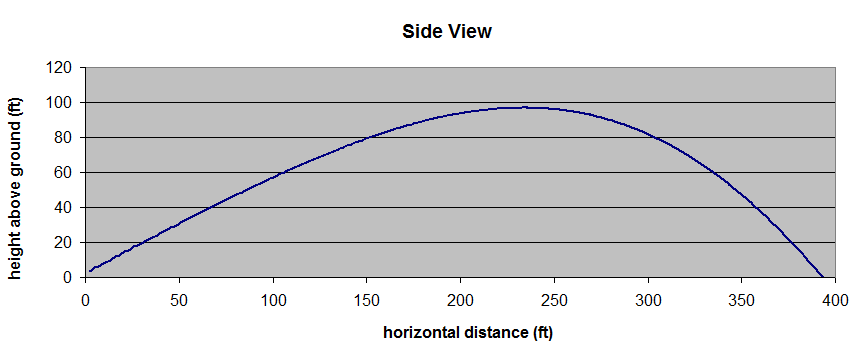
Side view of batted ball trajectory.
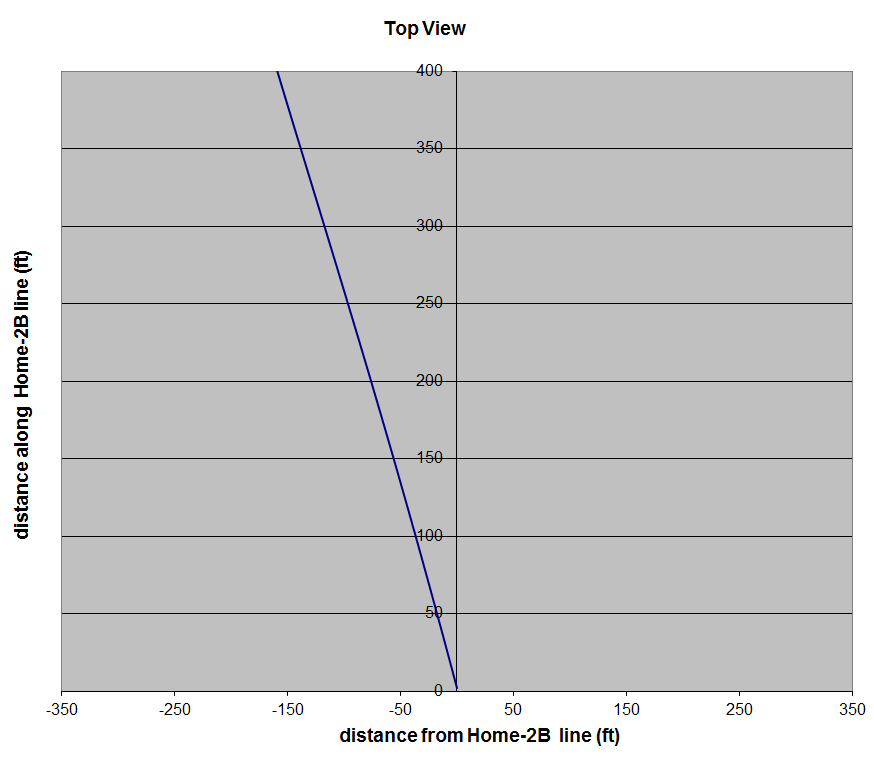
Top view of batted ball trajectory.
The default parameters for the batted baseball are as follows. The batted ball speed is 100 mph, the vertical launch angle is 30 degrees, the horizonatal spray angle is 20 degrees to the left of 2B, the ball has 2000 rpm of backspin and 200 rpm of sidespin. The trajectory for the batted ball is shown in the two figures. The ball travels nearly 400 ft and reaches a maximum height of nearly 100 ft. The top view shows that the ball veers to the left as a result of the sidespin.