The "Carry" of Fly Ball
There was much discussion in the early weeks of the 2009 MLB season about the large number of home runs hit in the new Yankee Stadium, leading to speculation that many of the home runs were aided by strong wind currents. Or, in the lingo of baseball, the ball was "carrying well" in Yankee Stadium. All this discussion stimulated me to ask the question, "Just what is meant by 'carrying well'?" Of course, we all have an intuitive notion of what this means. We observe a fly ball coming off the bat and have an expectation of how far the ball will travel. If the ball traveled farther than this expectation, we say that the ball carried well. And of course, vice versa. But can we come up with a more precise, less intuitive measure of "carry"? It is precisely this issue that led to the analysis presented in this report.
The analysis begins by recognizing that in a vacuum, all balls hit with the same initial velocity and launch angle will travel the same distance. In reality, the ball will travel more or less than that, depending on the influence of the aerodynamic effects of drag and the Magnus force, including any influence of wind. One way to define the "carry" is the ratio of the actual distance to the distance it would have traveled in a vacuum. An example is shown in the plot below.
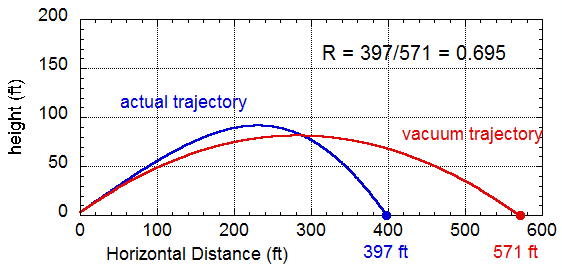
In this example, the ball is hit from a height of 3 ft above the ground with an initial velocity of 100 mph, a launch angle of 29 degrees, and a backspin of 2500 rpm, all values more or less representative of home runs in MLB. The blue curve shows the actual trajectory, where the height above ground level is plotted against the horizontal distance from home plate. The ball hits ground level at a distance of D=397 ft from home plate. The red curve shows the trajectory expected with the same initial velocity and launch angle if the ball traveled in a vacuum. The ball hits ground level at a distance of D0 = 571 ft from home plate. In this case, the "carry" R = D/D0 = 397/571 = 0.695. That is, the aerodynamic effect of lift and drag result in a distance that is about 70% of the vacuum distance. This calculation was done for an air density appropriate for sea level and 60oF. At a higher temperature or a higher altitude, the air density is lower and the expected distance D and the carry R are higher. Of course, the opposite is true at lower temperature. If the wind were blowing directly out at 5 mph, D would increase to 413 ft, so that R would increase by 4% to 0.723. If the wind were blowing directly in at 5 mph, D would decrease to 380 ft, so that R would decrease by 5% to 0.665.
With that background, let's now discuss the data, which consists of 819 home runs hit during the first six weeks of the 2009 season. The data consists of two parts. First is the so-called hitf/x data, courtesy of the folks at Sportvision. These data are an enhancement to the pitchf/x system which uses permanently installed video cameras in each MLB park to track the pitched baseball. The very same cameras can also be used to track the initial part of the batted-ball trajectory, from which the initital batted-ball velocity, vertical launch angle, and horizontal spray angle can be determined. Second is the hittracker data, courtesy of Greg Rybarczyk who measures the landing point and flight time of every home run hit in MLB. Combining both sets of data, an excellent approximation to the full trajectory can be determined using techniques identical to my analysis of Barry Bonds' 756th home run. In particular, the landing point determined by hittracker can be extrapolated to ground level with excellent precision, thereby determining D. The vacuum distance D0 can easily be calculated given the initial conditions determined by hitf/x. Therefore, for each of the 819 home runs, the ratio R = D/D0 can be determined and is shown in the plots below. By the way, this type of analysis could be applied to any fly ball for which the necessary information exists. I have restricted the analysis to home runs, since those are the only fly balls for which landing point and flight time are readily available.
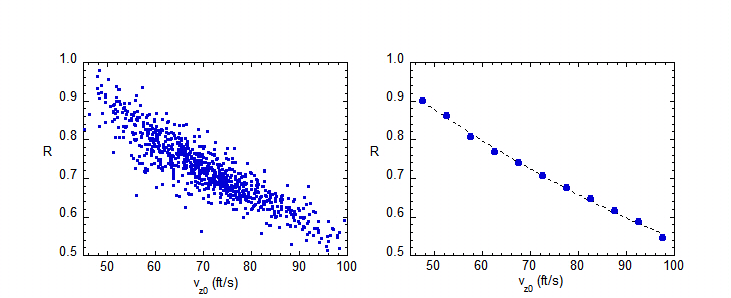
The left plot is a scatterplot of all 819 values of R, plotted versus the initial vertical velocity vz0, in units of ft/s. The data show a clear downward trend as vz0 increases, with some scatter about this average trend. The downward trend is a feature that is borne out by numerical simulations of typical fly ball trajectories. What is happening is that with a larger initial vertical velocity, the ball is in the air longer so that the drag force acts over a longer period of time, reducing the distance D. The right plot is a so-called profile plot of R vs. vz0. It is obtained from the left plot by dividing vz0 into 4 ft/s buckets, then calculating the average value of R for each of those buckets. The dashed curve is a simple polynomial fit to the observed values and represents the behavior of R averaged over all ball parks. We will refer to it as RN. The next step in the analysis is to consider home runs in each individual ball park. For each such home run, the value of R is determined, then normalized by dividing by the value of RN appropriate for the vz0 bucket. Finally, all values of R/RN for that particular ball park are averaged together to obtain a quantity I refer to as the "normalized carry" for that park. By its very construction, the average of the normalized carry over all ball parks is necessarily one. A value of normalized carry greater than one means that the ball carries better than average; a value less than one means that the ball carries worse than average. The normalized carry for each ball park is shown in the plot below, arranged in ascending order of carry. The average value of 1.00 is indicated by the red horizontal line. Standard errors in the mean values are indicated by the flags.
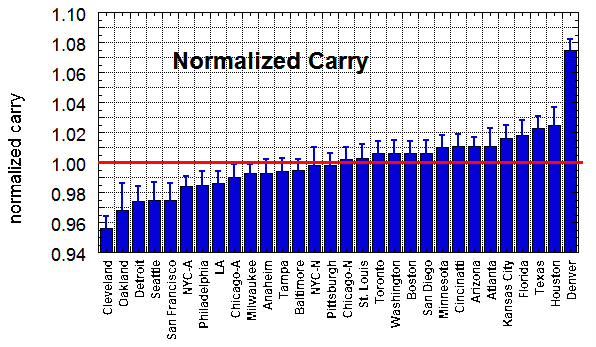
The striking thing about the plot is that Denver is head and shoulders above all the other ball parks, with a carry about 7.5% larger than average. Roughly speaking this corresponds to an extra 30 ft on a home run relative to the average. This result quantifies the expected additional carry in Denver based on the high altitude. On the opposite end of the spectrum is Cleveland, which has a carry about 4% lower than the average. Finally, the new Yankee Stadium has a carry about 2% below average. If home runs there were significantly aided by the wind, one might expect an above average carry. The fact that the carry is below average suggests that there is no evidence in the data analyzed that the baseball carries any better than average in the new Yankee Stadium. Indeed, only five ball parks have a lower normalized carry than Yankee Stadium.
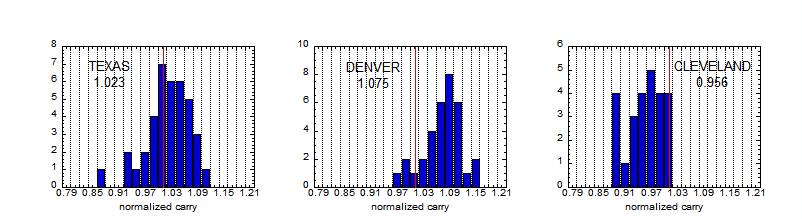
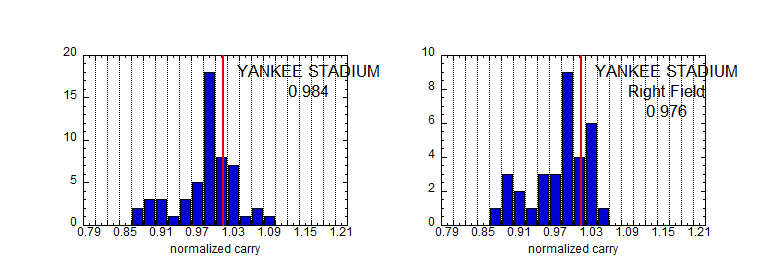
Rather than look at averages over all home runs hit in a given ball park, it is also interesting to look at the distribution of normalized carry for that particular park. The distributions for Denver, Texas, Cleveland, and the new Yankee Stadium are shown in the plots below, along with the mean value for each park. For reference, a red vertical line is drawn at the value 1.00, the average over all parks. Interestingly, nearly every home run hit in Cleveland has a normalized carry below 1.00. The opposite is true in Denver, with the normalized carry being larger than 1.00 for nearly every home run. The distribution in Texas is broad but with a mean at about 1.02, indicating better-than-average carry. The distribution of all the home runs in the Yankee Stadium (54 home runs analyzed) is peaked close to 1.00, with a secondary peak significantly below one (indicating poor carry) and a small handful of home runs (4) between 1.05 and 1.10 (indicating better than average carry). In the lower right plot is shown only those home runs in Yankee Stadium hit to right field (33 home runs analyzed). This plot is included because of the speculation that these home runs are particularly affected by wind. Nevertheless, we find no strong evidence in either plot that the baseball carries any better than average in the new Yankee Stadium. Indeed, if anything the data suggest the opposite.
The primary purpose of this report has been to quantify the notion of "carry" and to estimate the carry the different parks. The carry has to do with atmospheric effects and not with other factors, such as the dimensions of the park. On the other hand, one can ask a different question: "What is the relative ease of hitting home runs in the different parks?" The answer to that question depends both on the atmospheric effects and on the park dimensions. One way to characterize the relative ease of hitting home runs is by the mean initial velocity of the ball as it leaves the bat for home runs, v0. The smaller the value of v0, the easier it is to hit a home run; and, of course, vice versa. So, I have used the hitf/x data to find the mean v0 for each MLB park and have plotted them in the figure below, in ascending order and with error flags as in the carry plot. The horizontal red line is the MLB average, 101.1 mph.
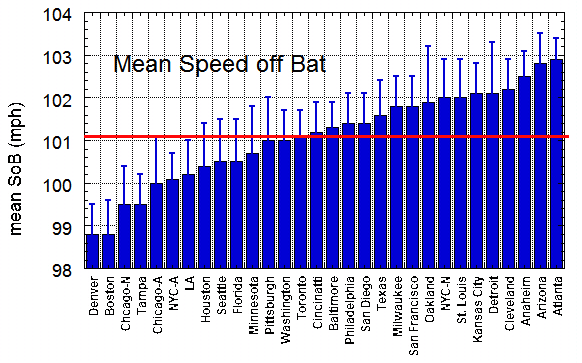
So, what does such a plot teach us? The clear winners (i.e., the easiest places to hit home runs) are Denver and Boston at just under 99 mph, and the clear losers are Atlanta and Arizona at about 103 mph. The spread between winners and losers is about 4 mph, corresponding to a distance of about 20 ft. Note that Yankee Stadium is in the "winner" category, with only five parks having a smaller mean v0. This result, when combined with the below-average carry in Yankee Stadium, seems to suggest that the large number of home runs there are due to close fences rather than abnormal atmospheric effects. At some point, I will look at home run statistics in these parks to see how well they correlate with v0.
As remarked earlier, all the data in this analysis come from the early part of the 2009 season. As more hitf/x and hittracker data become available, this analysis will be extended. It will be particularly interesting to see the expected seasonal effects that reduce the air drag with the warmer summer temperatures and therefore increase the carry. Moreover, with sufficient data it will be possible to slice things further, such as looking for day-night effects or whether the carry depends on the spray angle, as might be expected if there are directional wind currents.
It is a pleasure to acknowledge the assistance of Marv White, Greg Moore, and the entire gang at Sportvision for providing the hitf/x data and Greg Rybarczyk for providing the hittracker data and for keeping me honest.