
Anatomy of a Really Nasty Pitch
Update: Why is knuckleball movement so erratic?
On June 13, 2012, R. A. Dickey pitched at one-hitter against the Tampa Bay Rays at Tropicana Field. In the bottom of the third, Dickey struck out Will Rhymes with the pitch thrown in the above high-speed video clip. Take a good look at the pitch. Being careful not to be fooled by the upward movement of the camera or the movement of the catcher, see if you can notice that the pitch undergoes two distinct changes of direction. Shortly after release, it appears to move abruptly to the right; later it moves just as abruptly to the left. Poor Will never had a chance. In fact, even the catcher has a lot of trouble with the pitch, as we can see from the movements of his head and glove. There seems to be no question that this pitch gets very high marks on the nasty scale.
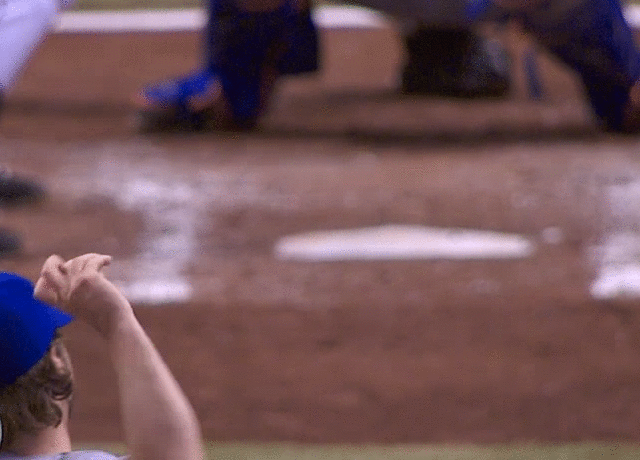
Dickey strikes out Will Rhymes with a nearly unhittable knuckleball.
Modern technology has given us two tools for analyzing this pitch. First, the high-speed video allows us to see the motion of the ball, including its rotation, in great detail. Second, we are very fortunate that the TrackMan Doppler radar system is set up in Tropicana Field, allowing a rather precise measurement of the trajectory of the pitch. In this article, I will both these tools in my attempt to unravel what is going on with this pitch.
First let's take a more careful look at the video clip. The first step in this process is to unravel the 110 individual frames from the animated gif image sequence, allowing us to inspect each image at a more leisurely pace. The ball initially leaves Dickey's hand at frame 12 and hits the catcher's mitt at frame 99. Knowing the release speed from TrackMan (see below), we can therefore estimate that the camera is operating at a speed of about 166 frames/sec. Next, we can track the flight of the MLB logo, which is clearly visible on the ball, to determine that the ball makes one complete revolution in 63 frames, so that the rotation speed is approximately 150 rpm. That is a very low rotation rate compared to the 1000-2000 rpm that is typical of normal pitches. But besides the low rate, the rotation axis is also unusual in that is appears to be a spiral, much like a bullet or forward pass in football. In other words, this pitch looks like a low-spin gyroball, making a total of about 1.5 revolutions.
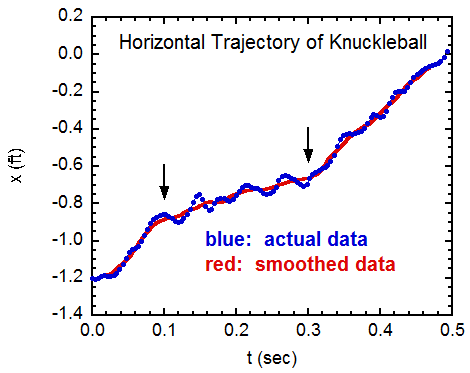
Now let's take a look at the TrackMan trajectory. The plot of the horizontal position (x) as a function of time is shown to the right. The coordinate system is such that x<0 corresponds to the right side of home plate, as seen by the pitcher. The blue points are the actual tracking data, measured in 0.004 second intervals. The wiggles in the data are almost surely not real but are an artifact of the radar measurement system. In fact, other "ordinary" pitches thrown in that game show similar wiggles. So let's ignore them in our analysis by averaging over the wiggles to obtain the red curve, which is a better representation of the actual trajectory of the ball. So what can we learn from looking at the red curve? The two seemingly sudden changes of direction that are seen in the video show up as changes in the slope of the red curve at times indicated by the two arrows. The ball initially starts out at x<0, which is expected for a right-handed pitcher, and is moving from right to left at about 4.7 ft/s. The first change of slope occurs about 0.1 sec. The ball doesn't actually move to the right; rather it continues to move to the left but at a reduced speed of about 1.2 ft/s. The second change of slope occurs at about 0.3 sec, increasing to about 3.6 ft/s.
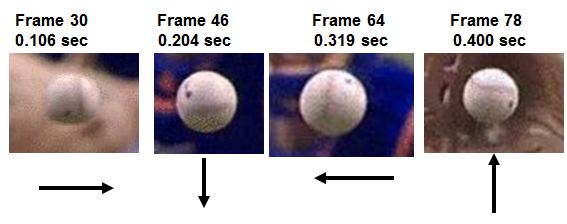
The next step in the analysis is to try to match up what we see in the video with what we measure with the radar. Actually, I am going to do even more than that. What I want to do is show how this pitch follows exactly the pattern of movement that is expected based on wind tunnel experiments. First take a look at the screen captures of the ball at the times indicated. Note particularly the orientation of the seam that is visible to the pitcher. If you want to find the orientation of the ball as seen by the catcher, just flip left and right. So, in the picture at 0.106 sec, the seam is vertical and on the pitcher's right. To the catcher, the seam that he sees on the opposite side is also vertical and to his left. And that is the direction that the ball is expected to break according to the wind tunnel data--to the catcher's left or pitcher's right, just as we see in both the video and the tracking data. Now, since the ball is thrown with gyro-spin, the seam responsible for the movement simply rotates about the direction of motion. So, at 0.204 sec, it is horizontal and on the lower half of the ball, resulting in a downward break. At 0.319 sec it is again vertical resulting in a break to the pitcher's left. And so on. The direction of the force responsible for the movement simply rotates around clockwise, as viewed by the pitcher, and is indicated by the arrow in the figure.
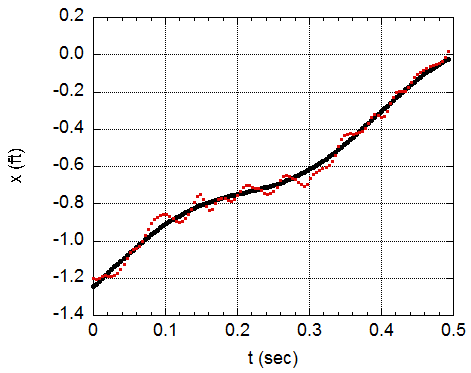
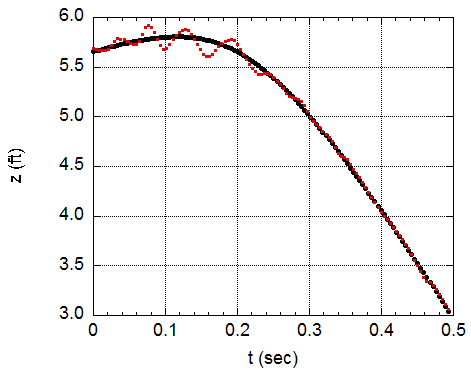
Now take a look at the next two figures, which shows both the horizontal and vertical tracking data plotted as function of time. The red points are the actual data and the black curves are the expected behavior of the data if the force follows a circular pattern as expected from the wind tunnel data. Again ignoring the non-physical wiggles, the curves do a remarkably good job accounting for the data. The size of the force is comparable to that found for a typical curveball, meaning it is neither unusually large nor unusually small. The "double break" is a consequence of two things: the circular pattern of the force and the fact that the ball rotated 1.5 revolutions. Had the ball been thrown with, say, only 1 revolution, the movement associated with the second break (to Dickey's left) would have occurred too late in the trajectory to have much of an effect. Note that the force also affects the vertical motion, although that is much harder to discern because that motion is largely determined by gravity.
So let me summarize what we have managed to accomplish. We have high-speed video, we have tracking data, and we have wind tunnel measurements. And all of these individual pieces seem to be consistent with each other. Despite the changing direction of the force, the trajectory is still very smooth, producing no sudden changes which would be highly unphysical. Such a trajectory, despite its smoothness, would not be well fit by the usual constant acceleration model used in the PITCHf/x system. As an added bonus, perhaps we have stumbled onto something of very practical value, namely, the effectiveness of the gyro-rotation in producing multiple breaks in the trajectory. Did Dickey do this on purpose? Does he know something that we are only starting to discover? I'd love to know the answer to that question. Perhaps there is a future for me as staff scientist at the Knuckelball Academy! Or not.
Why is knuckleball movement so erratic?
By now it is well established that knuckleball movement is erratic. What exactly do I mean by that? I mean that the movement, defined to be the deviation from a straight-line trajectory, is random from pitch to pitch. Sometimes that movement is to the left, sometimes to the right, etc. That is quite unlike the behaviour of "normal" pitches, which are quite predictable in how they move. Indeed, it is precisely this predictability, along with release speed, that lies at the foundation of pitch classification schemes. The unpredictable nature of knuckleball movement has been studied since the early days of PITCHf/x. One of the earliest articles was the excellent piece written by John Walsh, Butterflies Are Not Bullets, and published in The Hardball Times in November 2007. So here's the big question: Why is the movement of a knuckleball so unpredictable? Now that we have a pretty good model for the forces that give rise to the trajectory of this particular R. A. Dickey pitch, we are in a position to start answering that question.

In the image above, I have replotted the trajectory of the pitch in the horizontal plane (i.e., a view from above), with the same left-right viewpoint as in the video. The black patch represents the width of home plate. The blue curve is the fit to the tracking data described above and represents our best estimate of the actual trajectory. Recall that the pitch makes 1.5 rotations between release and home plate. Now let's keep almost everything the same about this pitch. That is, the release point, the initial speed and direction, the initial seam orientation, the spin axis, and the relationship between the forces and seam orientation are all the same. However, suppose that R. A. spins the ball a bit more slowly, so that it makes 1.0 rather than 1.5 revolutions. What would the trajectory look like? Given our mathematical model for the trajectory, we can easily answer that question: It would look exactly like the red curve. The two curves fall right on top of each other from release to about 40 ft from home plate, but thereafter they deviate strongly. Indeed, the red curve ends up on the outer edge of home plate while the actual pitch landed right in the middle. That's a difference of over 8 inches. The fact that these two pitches differing only in the spin rate behave so differently from each other gives us considerable insight as to why the movement is so erratic, i.e., so different from one pitch to another.
The knuckleball may very well be a manisfestion of what physicists would call Chaotic Dynamics, whereby small changes in the initial conditions of the system (in our case, the spin rate) give rise to large changes in the outcome (in our case, the location at home plate). This is currently the topic of a study that I am undertaking in collaboration with my long-time friend and frequent collaborator Rod Cross. Having inspected dozens of high-speed video of Dickey's pitches from 2012, we have found considerable pitch-to-pitch variation in the rate of rotation, and to some extent in the axis of rotation. Can we correlate the variations in rotation with variations in movement? That is one of the questions we hope to answer with our research, which is very much a work in progress. The initial results certainly look encouraging. Stay tuned for future updates.
In closing, let me thank the good people at Sportvision and TrackMan for providing me tracking data for my research projects.